Colorado Avalanche Information Center Dashboard
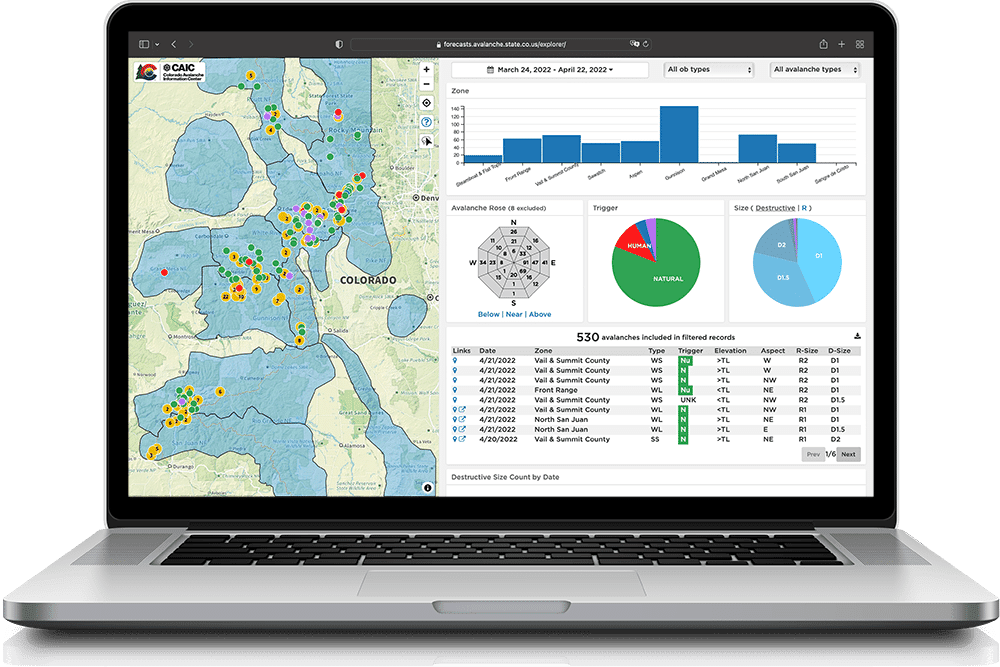
Interactive dashboard to allow avalanche forecasters to easily analyze recent avalanches.
- Combines information from two different state agencies, each running different software
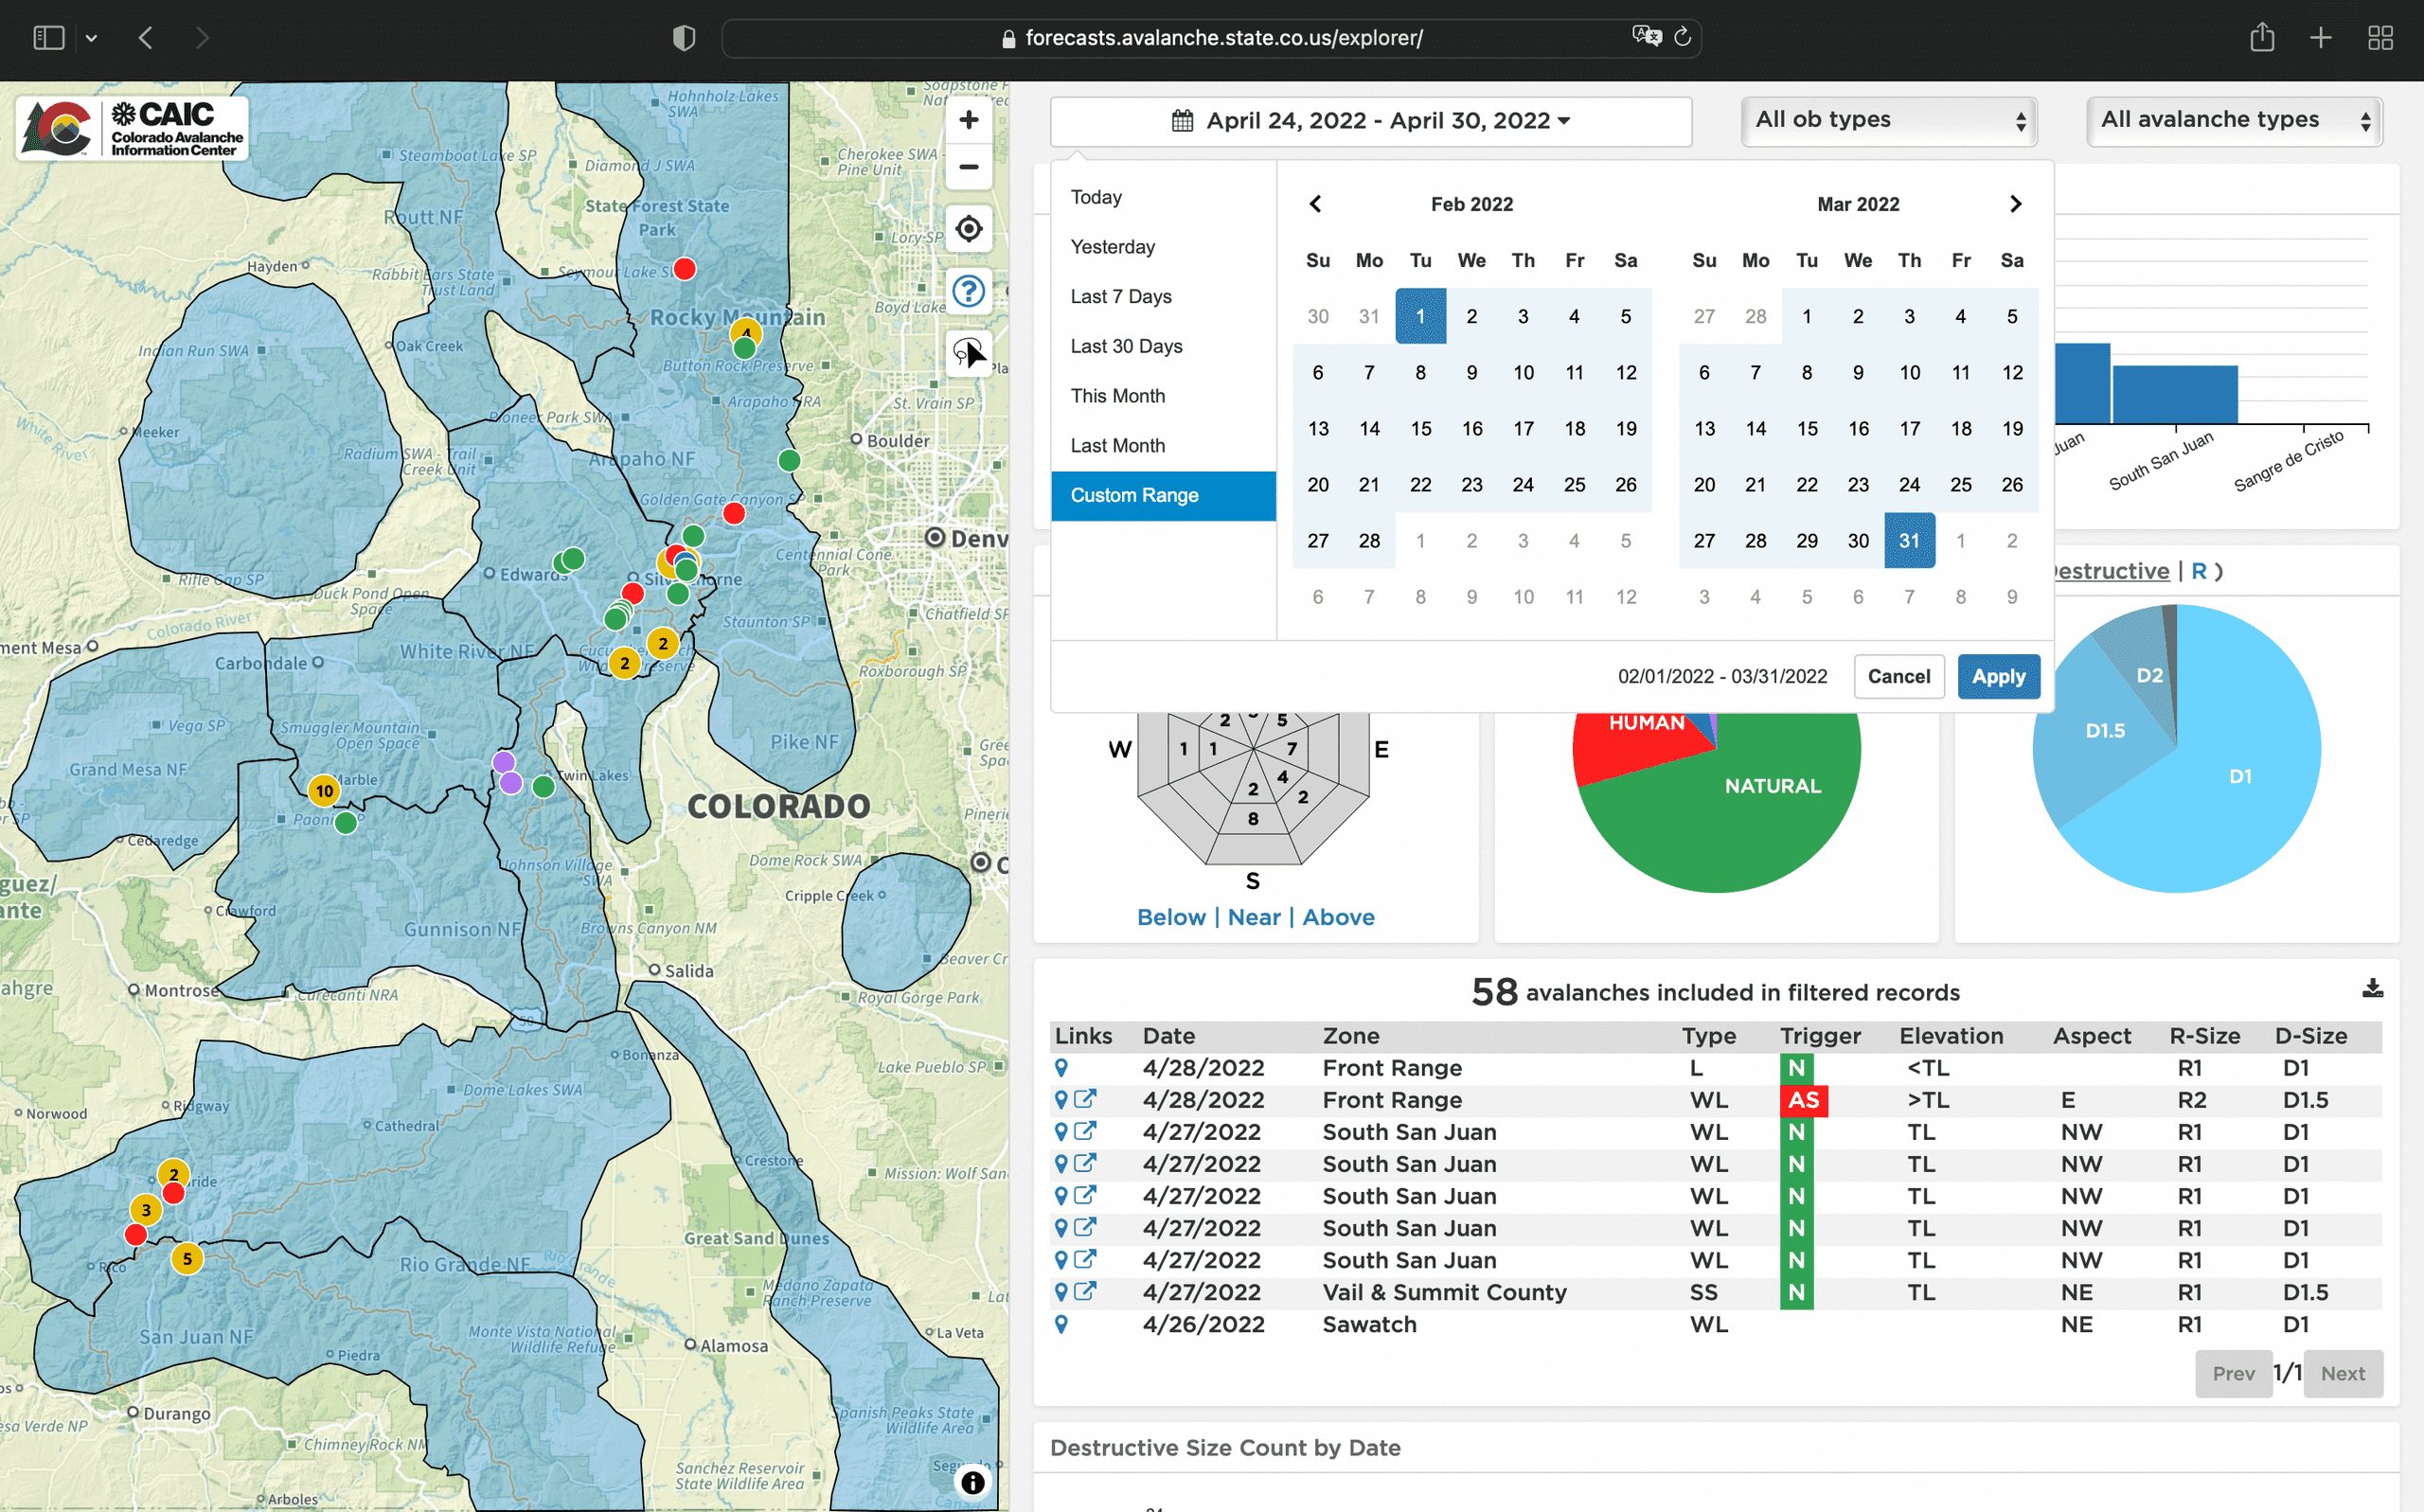
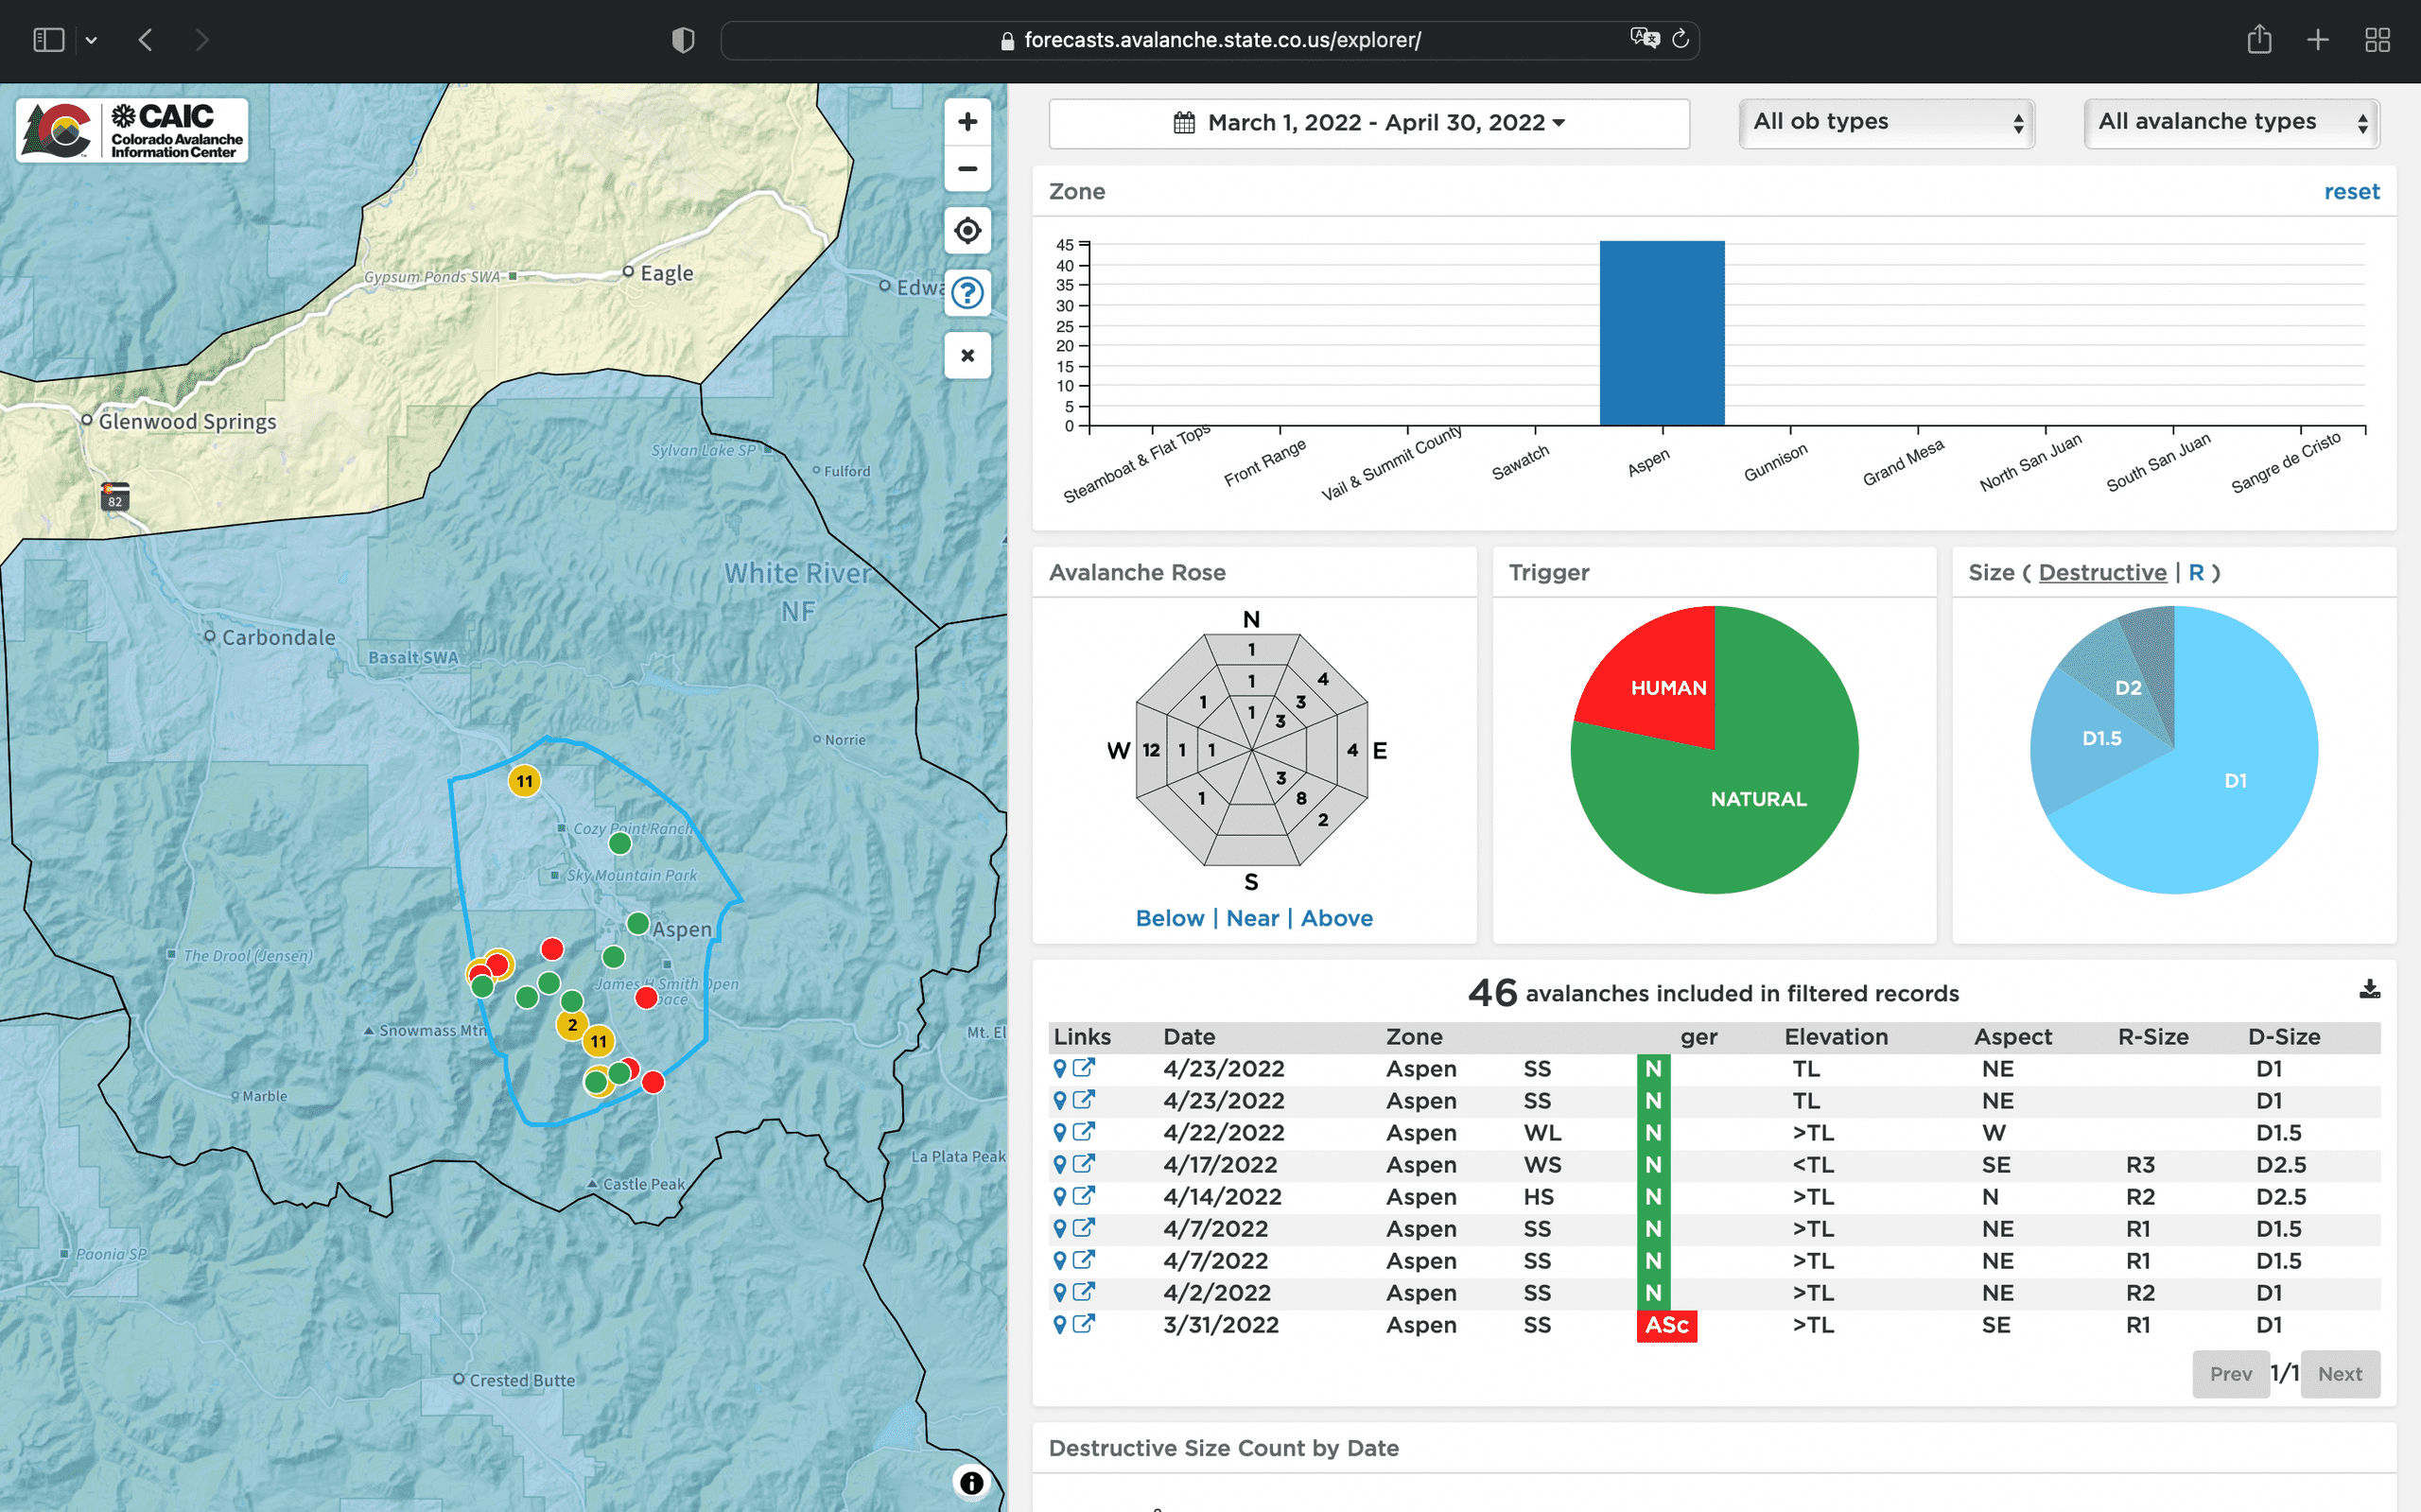
- Clicking charts allows users to intuitively filter the data using multiple dimensions to generate a report customized to their needs
How We Help
The Colorado Avalanche Information Center compiles multi-dimensional data on thousands of avalanches that occur statewide each year. We worked with them to create an interactive dashboard that allows both professional avalanche forecasters and recreational backcountry users to analyze recent avalanche activity to ensure they're aware of the current risks that the snowpack presents. Users can easily filter the dashboard to see only the information that is relevant to their planned trip, providing a quick and accurate picture of what they can expect when venturing outdoors in the winter.
Highlights
- The dashboard integrates data from multiple state agencies, allowing users to see observed avalanches from disparate sources all in one place.
- The ability to cross-filter on multiple dimensions simultaneously provides incredible versatility when users are only concerned with a specific subset of the data.
- We were able to provide a quick prototype within days of starting the project, greatly increasing the speed at which we could iterate and get the final version in production.
- One dashboard services both forecasters and the general public: we were able to save considerable development time by conditionally rendering different aspects of the page if forecasters are already logged into the main CAIC site.
- This standalone app seamlessly integrates with their existing site and design aesthetic.

Mike Cooperstein
Colorado Avalanche Information CenterWe worked with geodav to create a dashboard that is used by forecasters and the public to view the distribution of avalanches.