Oil & Gas Well Log Dashboard
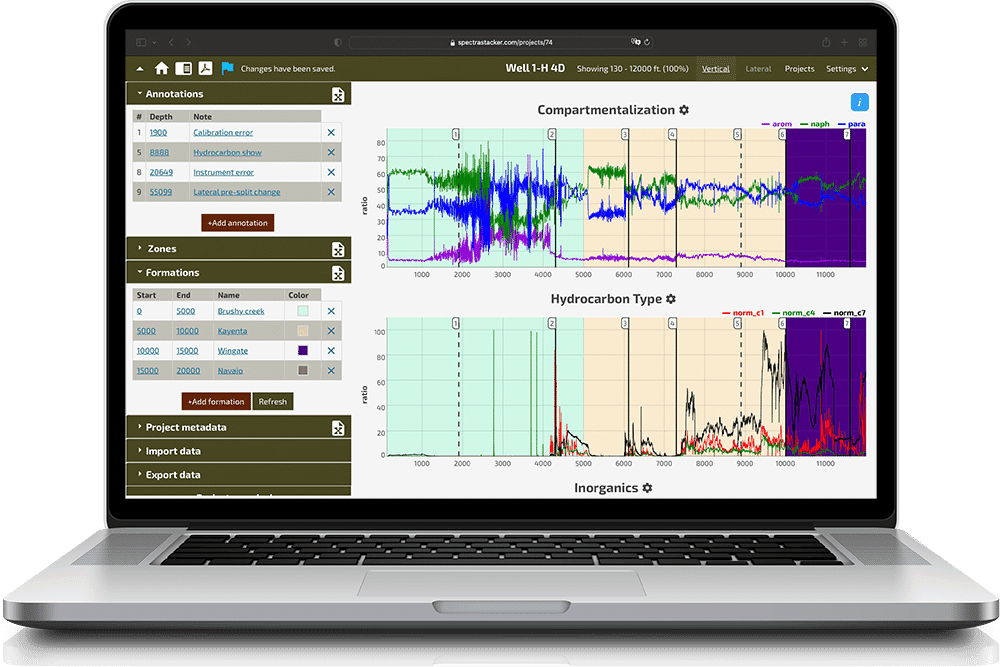
Web app to process and visualize well log data, allowing real-time collaboration among geologists at well sites across the nation.
- Processes raw well data into graphs that can be annotated and shared
- Like Google Docs but for oil and gas well data
How We Help
Field Geo Services is a geologic service company that manages a great deal of subsurface data. After years of plotting well logs in Excel and sharing large clunky files among geologists, they tasked geodav.tech with helping to find a more elegant solution to well log management. We worked with FGS to create Spectra Stacker: a web-based platform that allows their geologists to quickly input and analyze subsurface data, taking raw well logs and transforming them into collaborative, editable charts and annotations that can be easily shared across the company.
Highlights
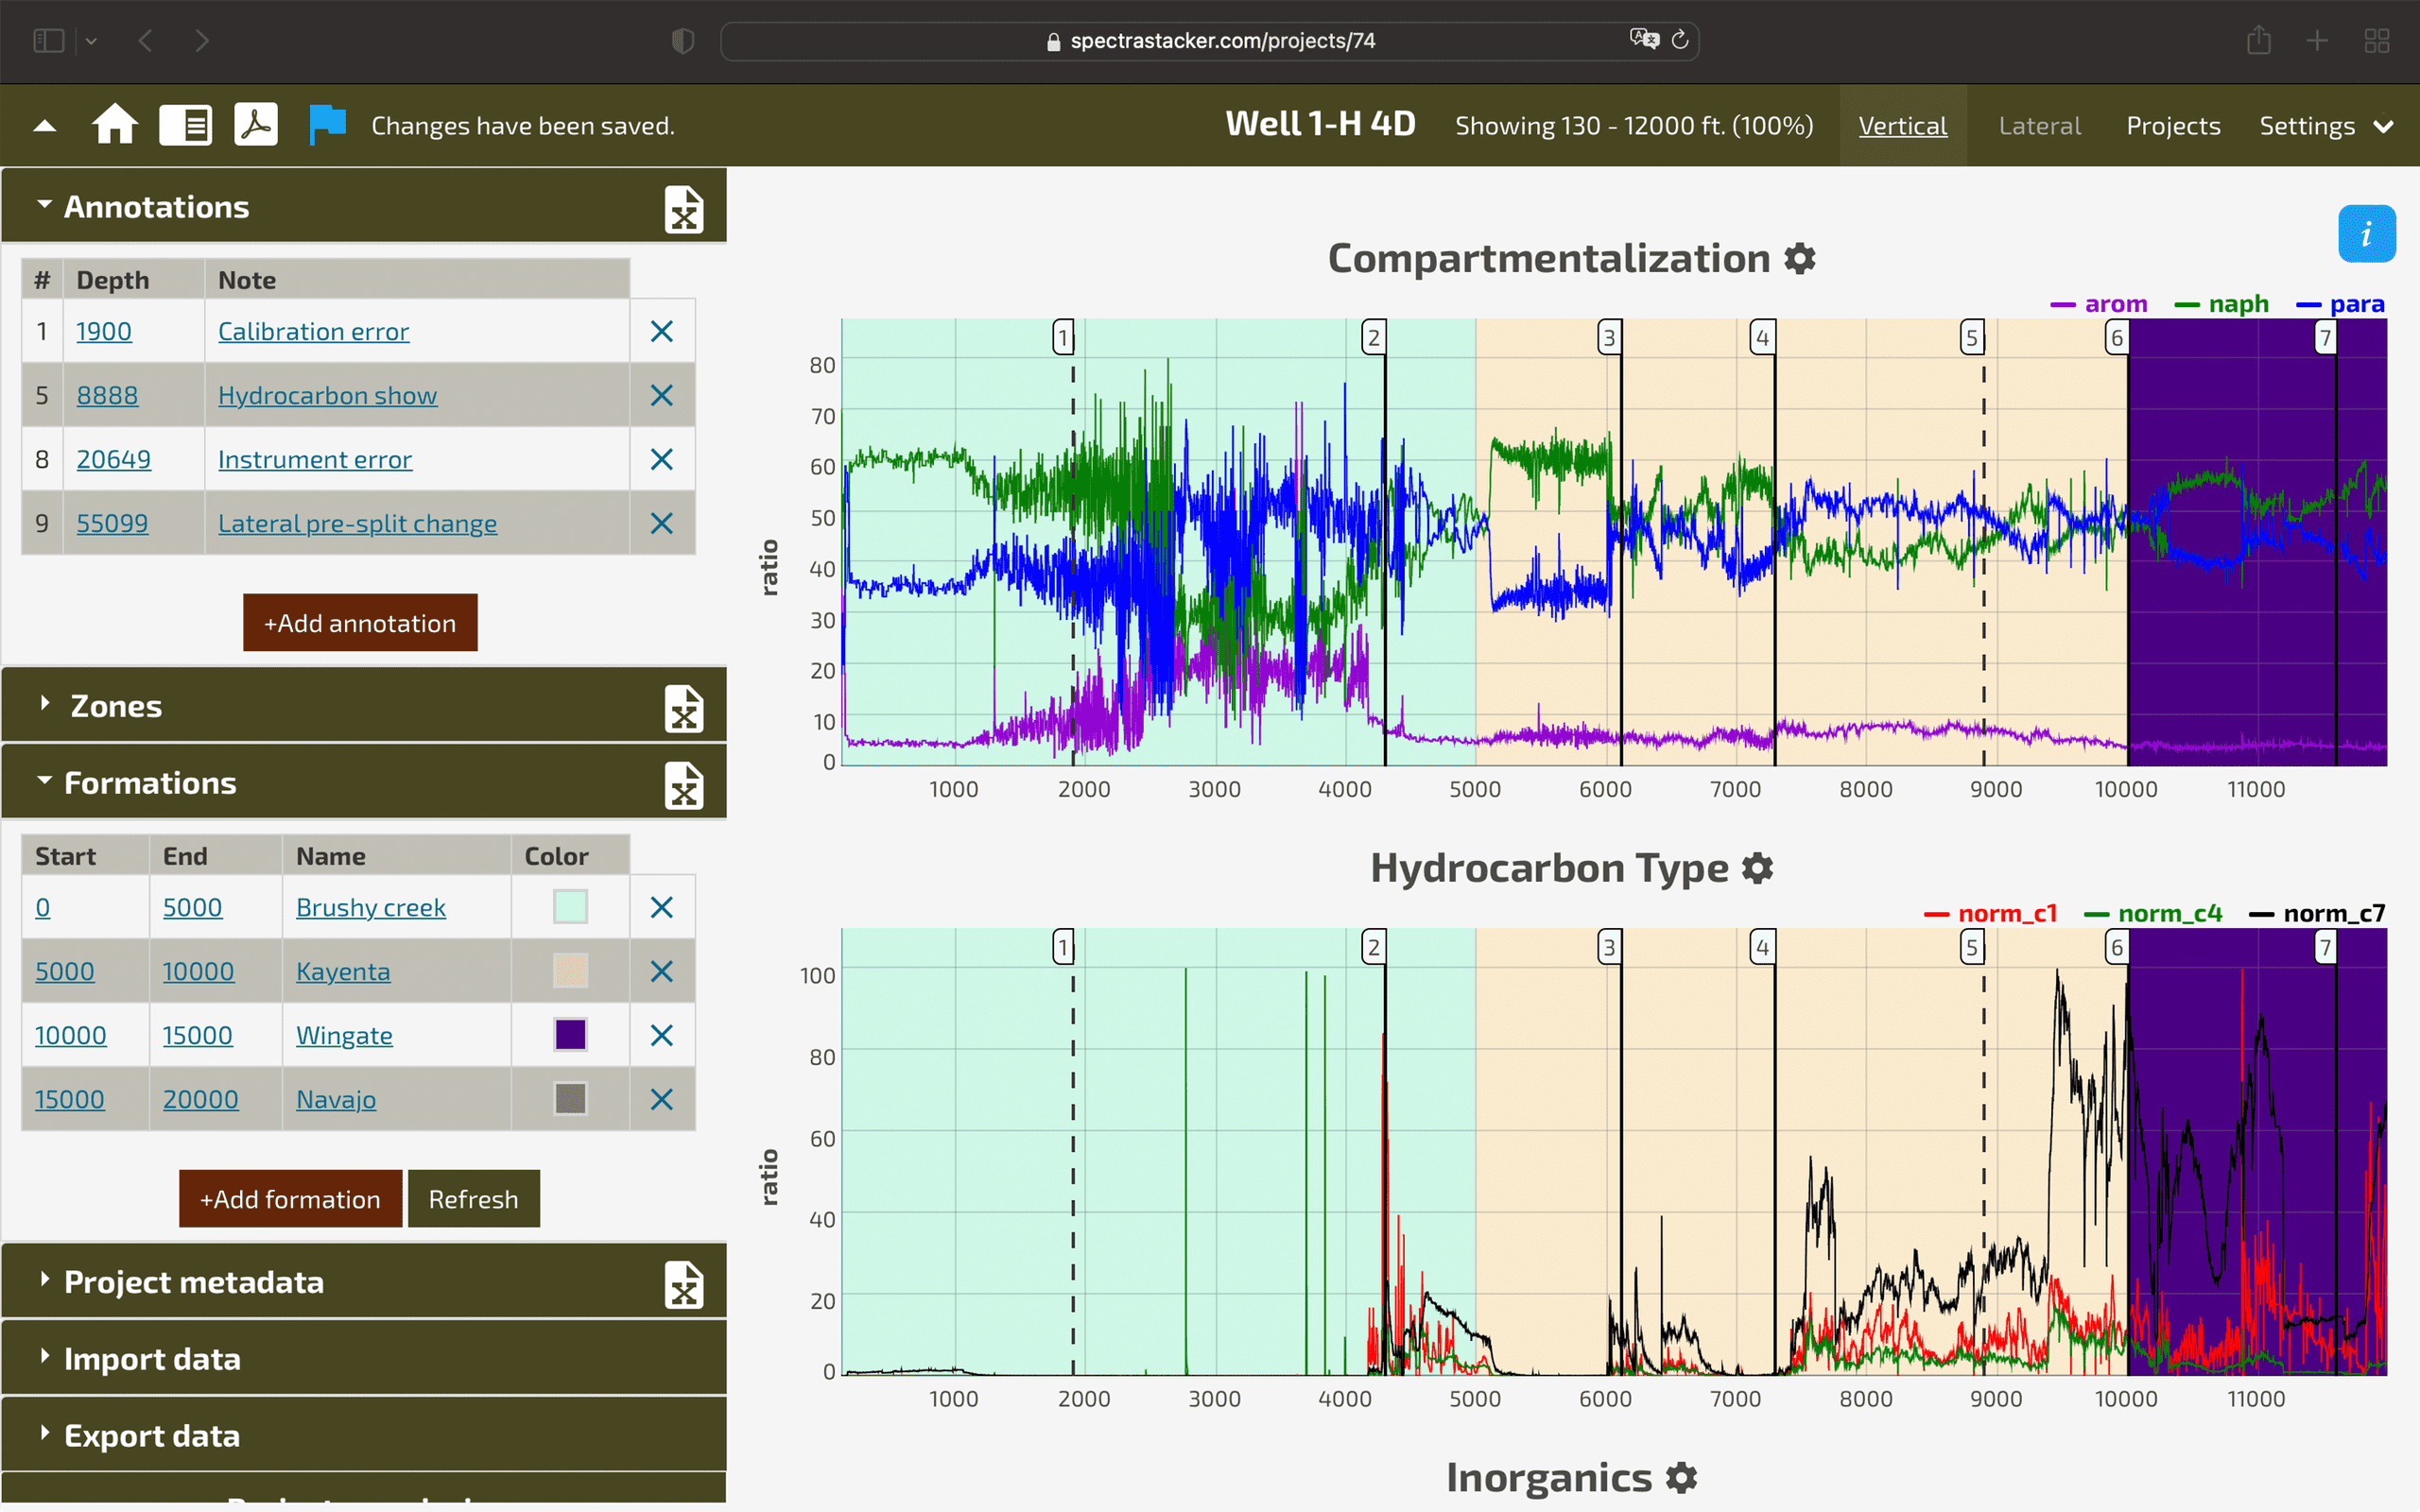
- The dashboard allows geologists to quickly import well log data, plot it on configurable charts, and share meaningful insights with their team.
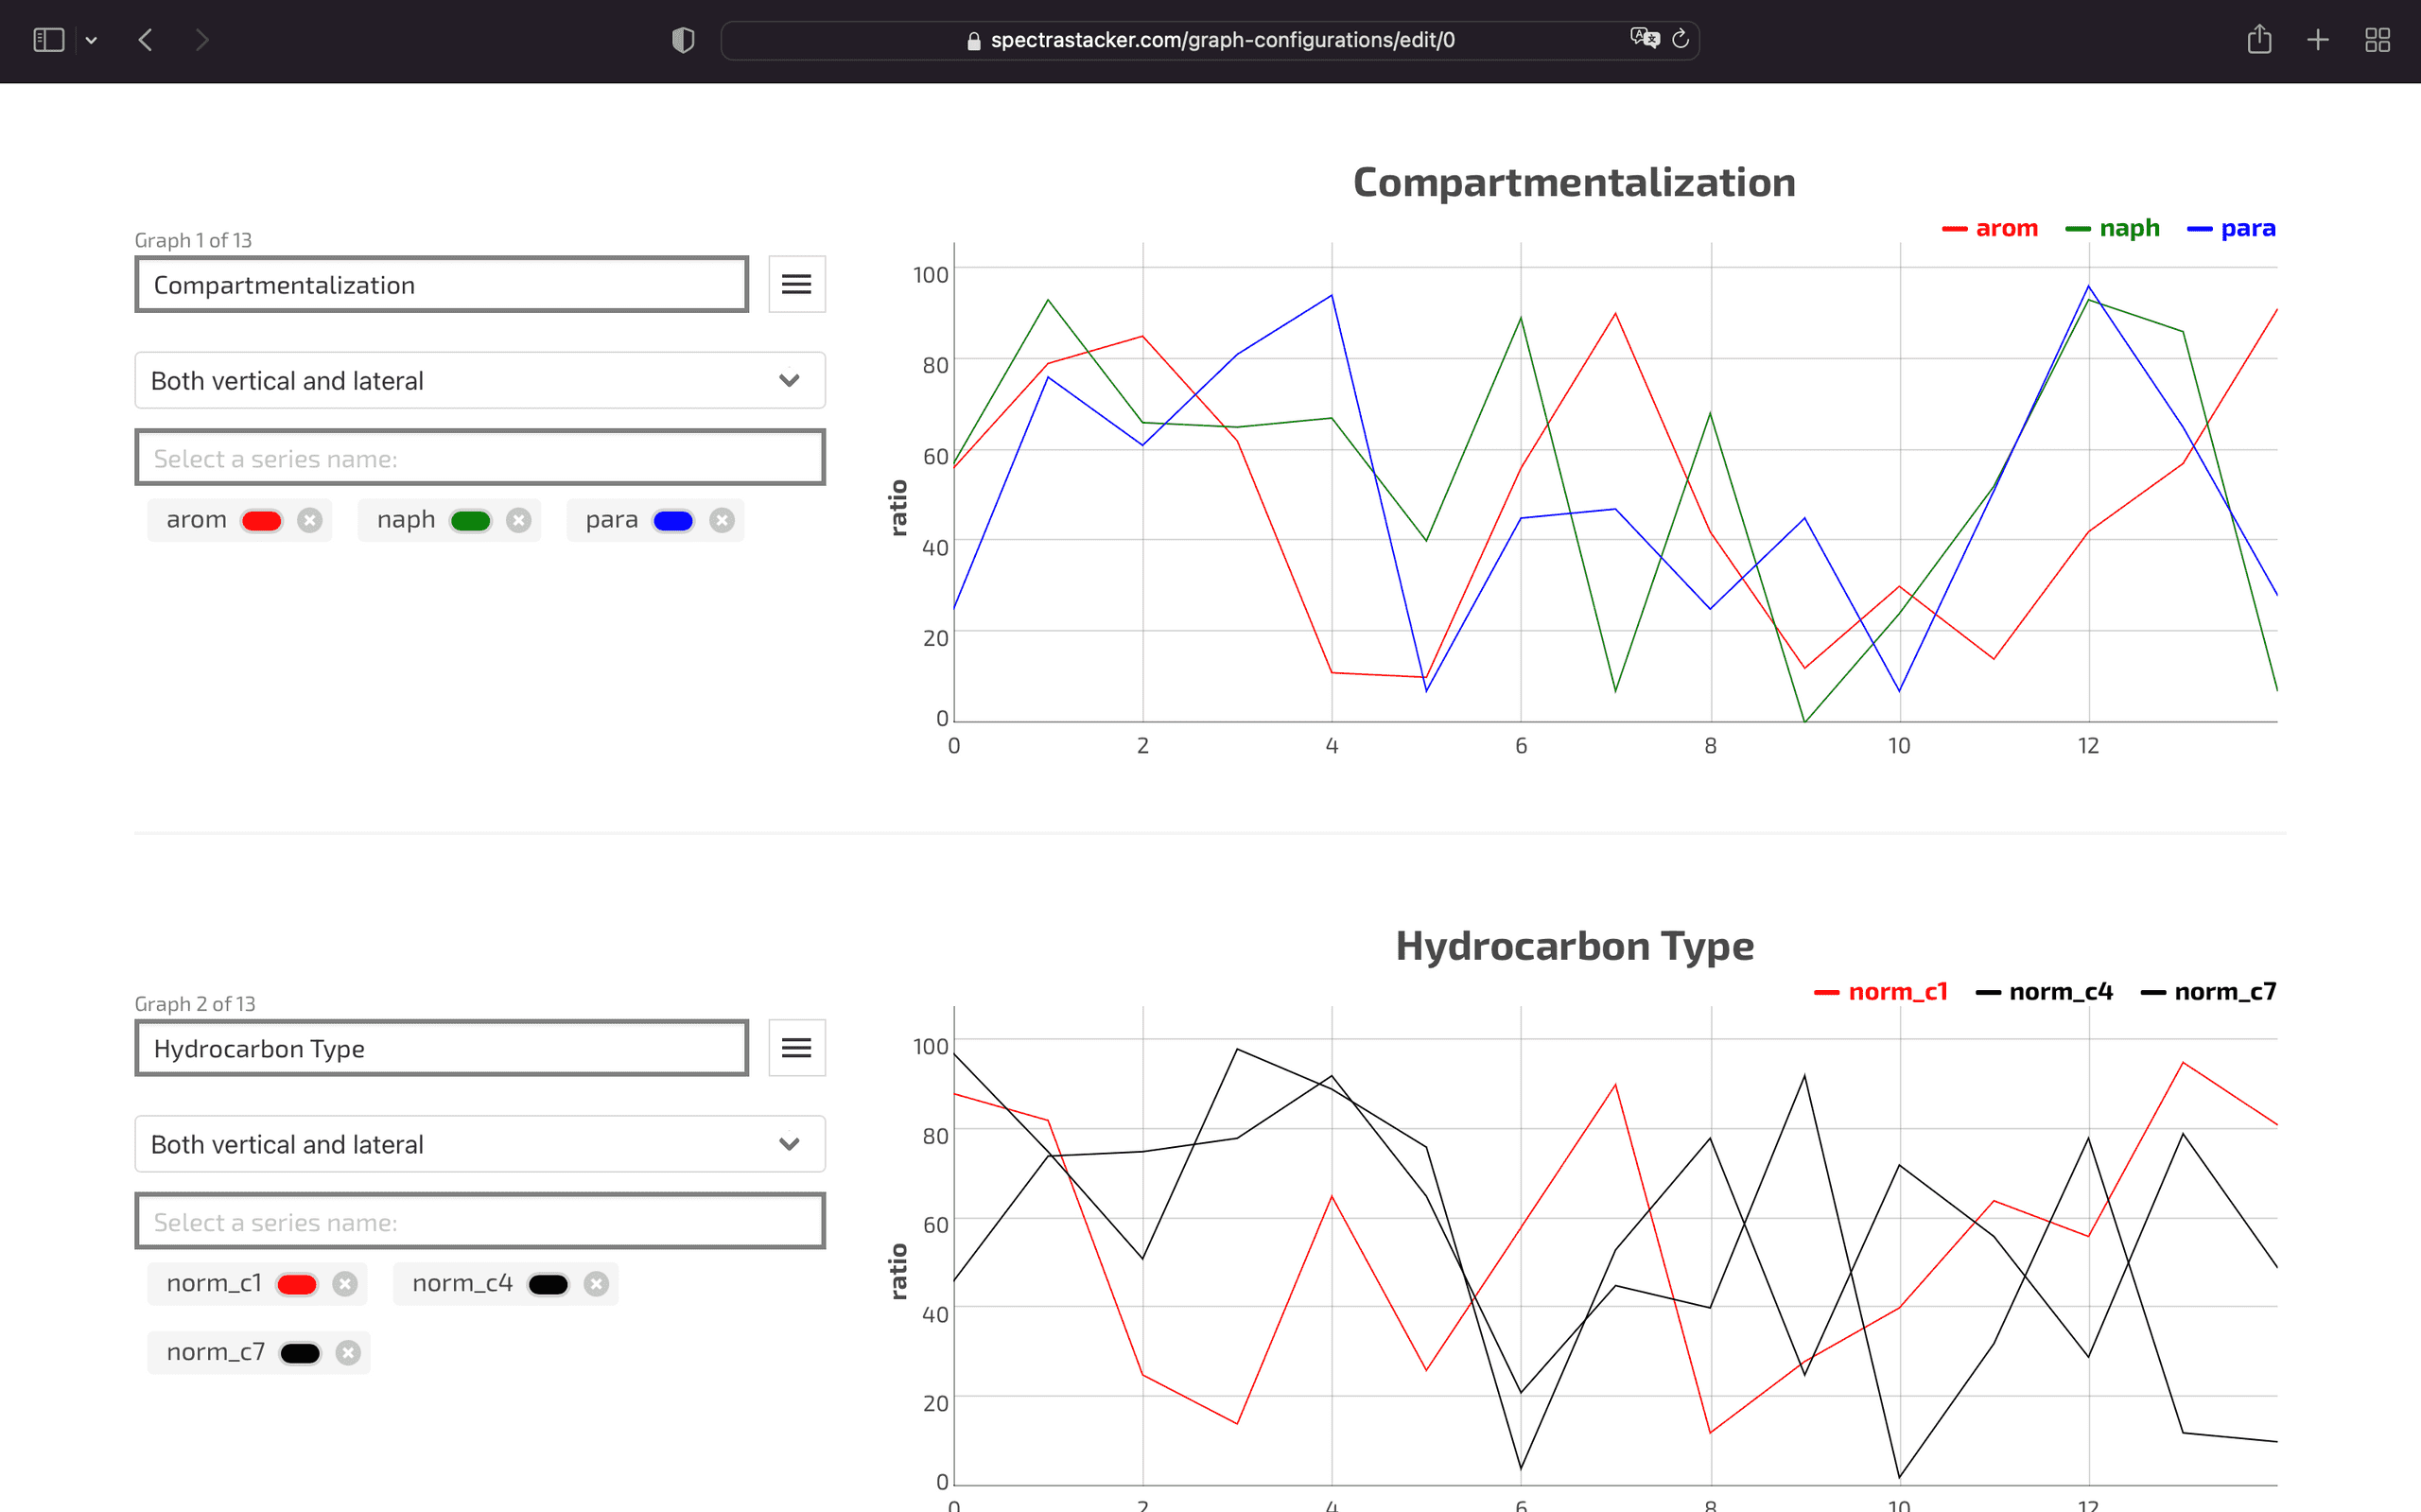
- The charts are completely customizable: users can display what's most important to each project.
- Administrators can easily manage multiple projects, control who can view/edit the data, invite multiple collaborators on projects, and annotate charts with collaborators in realtime.
- Well log data can be manipulated and exported back to a readable LAS file.
- Charts can be annotated and exported to PDFs to share via email.